
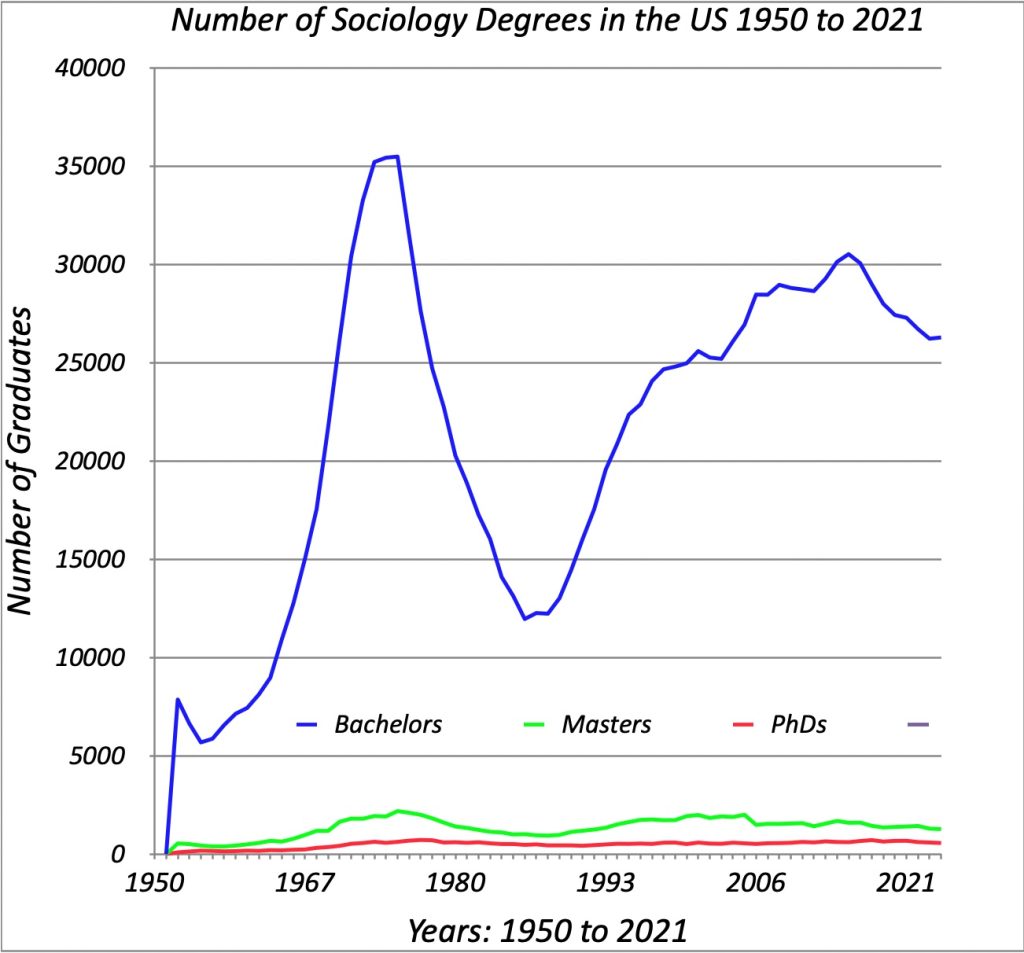
The maximum year for Bachelor’s degrees was 1973-74 (35,491) and the minimum was 1984-85 (11,968).
The maximum year for Master’s degrees was 1973-74 (2,196) and the minimum was 1957-58 (397). Later, 1987-88 was low (984).
The maximum year for Doctor’s degrees was 1973-74 (2,196) and the minimum was 1949-50 (98). Later, 1989-90 was low (432).
In 2020-2021the number of Sociology Bachelor’s Degrees was 26,291, Master’s Degrees 1,283 and Doctor’s Degrees 573. This downward turn after three decades of growth could reflect different size age cohorts and relative interest in Sociology. Remember that these are raw numbers and not rates. The large peak in the early 1970s is probably a baby-boom effect and the rise around the turn of the century a second wave effect from the baby-boom.
What other factors might affect the number of sociology graduates?
SOURCE: U.S. Department of Education, National Center for Education Statistics, Earned Degrees Conferred, 1949-50 through 1969-70; Higher Education General Information Survey (HEGIS), “Degrees and Other Formal Awards Conferred” surveys, 1970-71 through 1985-86; Integrated Postsecondary Education Data System (IPEDS), “Completions Survey” (IPEDS-C:87-99); and IPEDS Fall 2000 through Fall 2021, Completions component. (This table was prepared October 2022.) You can find the source here.